Cedar Wealth Management
TRADING PLATFORM
Cedar Wealth Management
WHAT IS A TRADING PLATFORM?
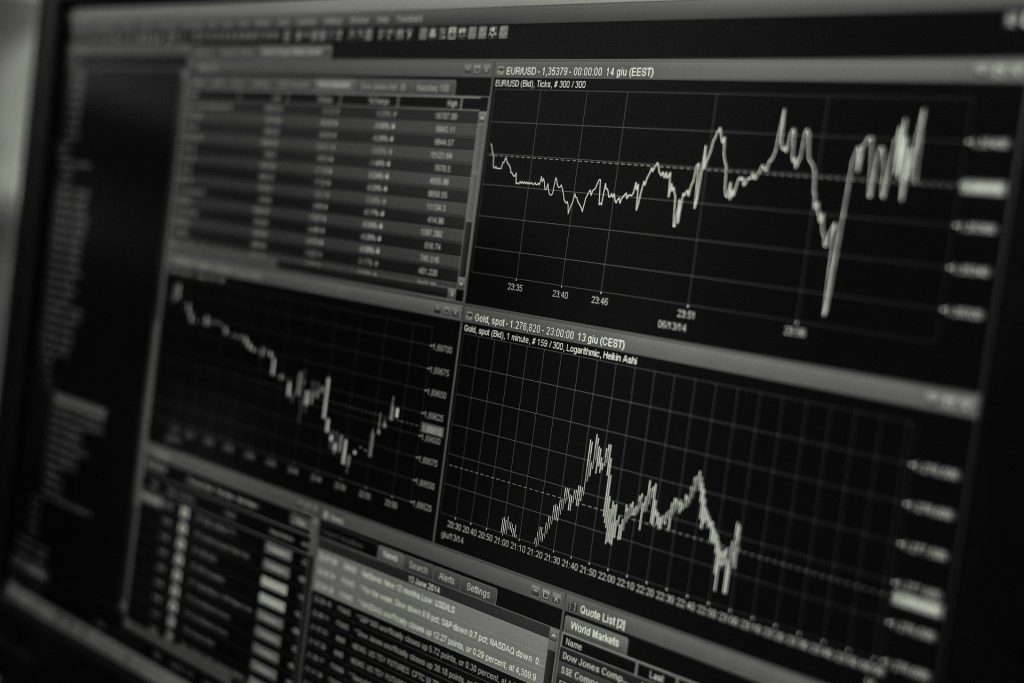
A trading platform can be defined as a software system offered to investors and traders by certain financial institutions, such as brokerages and banks. Essentially, trading platforms enable investors and traders to place trades and monitor their accounts.
Often, trading platforms include other features that help investors make their investment decisions. These features can include real-time quotes, interactive charts, and a range of charting tools, streaming news feeds, and premium research. Platforms also may be tailored to specific markets, such as stocks, currencies, options, or futures markets.
METATRADER 4 PLATFORM
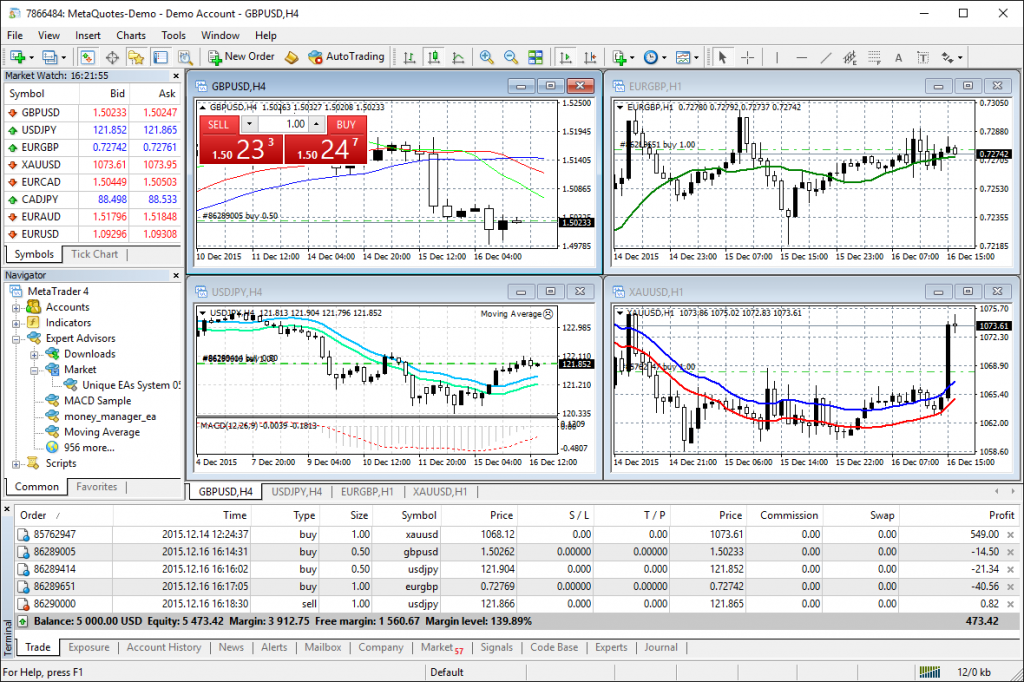
MetaTrader 4 (MT4) platform is a trading platform developed by MetaQuotes in 2005. Although it is most commonly associated with forex trading, MetaTrader 4 can be used to trade a range of markets including forex, indices, cryptocurrencies, and commodities, via CFDs.
MT4 is extremely popular due to the fact that it is highly customisable to your individual trading preferences. It can also be used to automate your trading, using algorithms which open and close trades on your behalf according to a list of set parameters.
FEATURES AT A GLANCE:
METATRADER 4 HAS THE FOLLOWING ADVANTAGES:
- Main menu – access to the program menu and setting;
- Toolbars – quick access to features and settings;
- Chart window Information on the historical performance of the price of a particular
financial instrument; - Market Watch window– contains the symbol list with real-time quotes for the various
instruments; - Navigator window – quick access to your specifics for prompt use (e.g. accounts,
indicators, expert advisors; - Terminal window – prompt access to see open trades, account history and more.
- Access to all markets – Forex, Commodities, Indices;
- Intuitive design and easy handling, multi-graphics;
- Сreating individual, customized workspaces;
- Trading with automated expert systems (expert advisors);
- Nо Dealing Desk execution.
Charts are one of the most useful tools available to a forex trader and they can greatly enhance a trader’s strategy if used correctly, especially for those using technical analysis. MetaTrader 4 has three chart types which we will briefly elaborate below.
Line chart
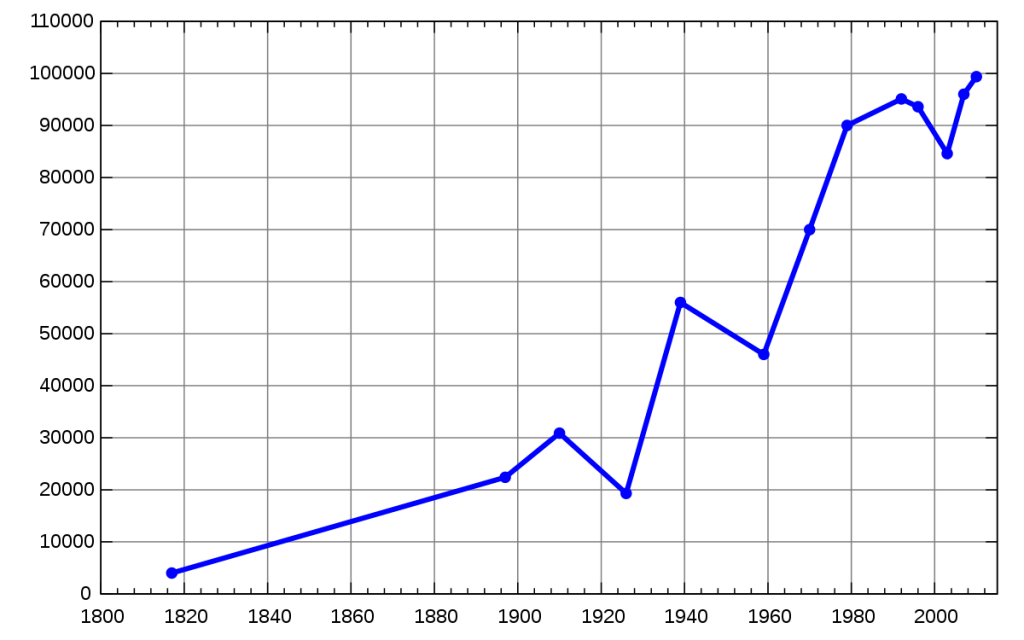
A line chart is a type of chart used to show information that changes over time. Line charts are created by plotting a series of several points and connecting them with a straight line. Line charts are used to track changes over short and long periods.
bar chart
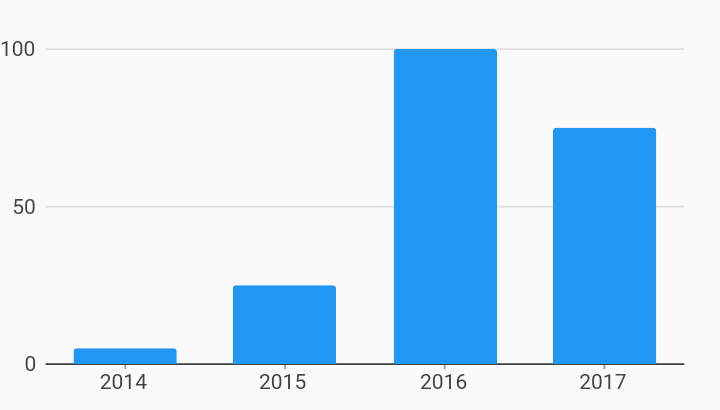
A bar chart or bar graph is a chart or graph that presents categorical data with rectangular bars with heights or lengths proportional to the values that they represent. The bars can be plotted vertically or horizontally. A vertical bar chart is sometimes called a column chart.
This chart is created with the use of bars (hence the name). Each bar is a representation of the periodicity, for example if the time frame is set to M5 or 5 minutes, then each bar will represent 5 minutes of prices Different colours can be selected to represent bars that close higher than they open (bullish bars) or the inverse, those that close lower (bearish bars) – we will see how to change colours later in this section.
Candlestick chart
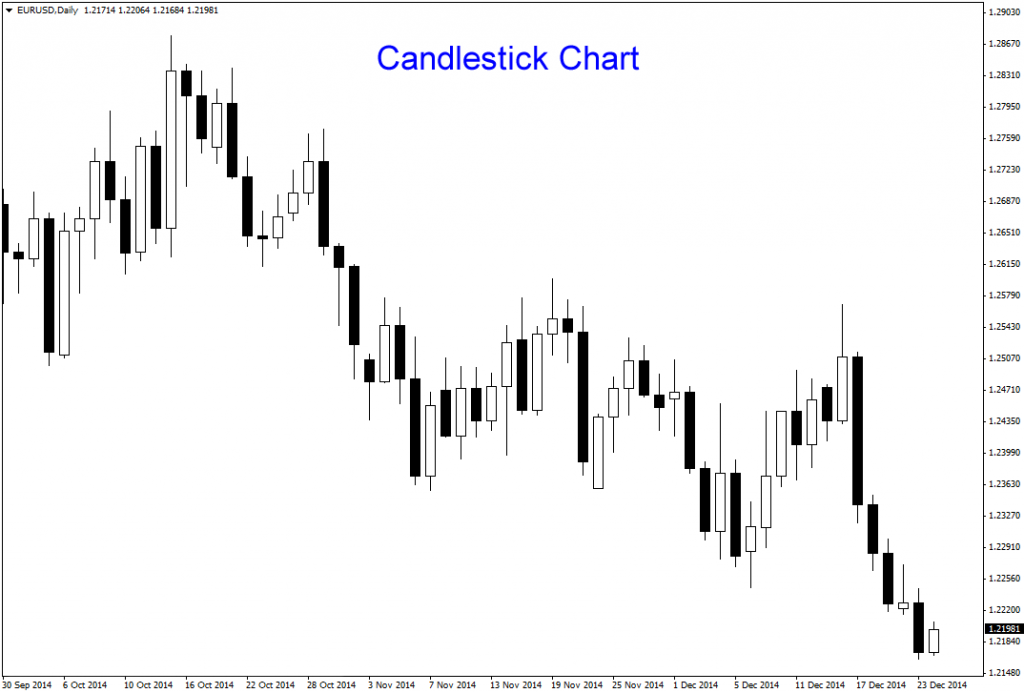
Candlestick charts are a technical tool that packs data for multiple time frames into single price bars. This makes them more useful than traditional open-high, low-close bars or simple lines that connect the dots of closing prices. Candlesticks build patterns that predict price direction once completed.
Candlesticks show that emotion by visually representing the size of price moves with different colors. Traders use the candlesticks to make trading decisions based on regularly occurring patterns that help forecast the short-term direction of the price.
For each chart that you have open in the chart window, you can individually change its appearance and properties. In order to do this you can either follow the path Charts > Properties on the main toolbar, you can right-click anywhere in the chart window and select Properties, or simply use the hot key F8.
Meta-trader 4 also have what is known as the market-watch window, this window lists all the quotes for the instruments on your account. In the standard setup this window would be on the left hand side. If you can’t see this window – you can either go to View > Market Watch use the hot key. Or you can select from the Standard toolbar. Why you should use the xmt4 trading platform
- Extensive functionality
- Accessibility; open one account, available on all platforms Backtesting functionality to test efficacy of trading strategy.
- Auto trading ability with customized bots
- Low market maker and taker fees
- High leverage options
- Copy trading from expert traders
ACCESSIBILITY
HOW TO USE THE XMT4 ON YOUR DEVICES WEB:
- Click on the xmt4 url
- Click on the register or login button to fill in your details Start trading Mobile devices:
- Go to your respective native stores; the google playstore or apple store
- Search for xmt4
- Register or login if you have an existing account.
HOW TO USE THE XMT4 ON YOUR PC:
- Click on the download link
- Register or login
- Start trading
XMT4 MINIMUM DEVICE REQUIREMENTS
- Operating System: Vista, Windows 7, Windows 8/8.1, Windows 10.
- Processor: Intel Core i3 or equivalent, recommended- Intel Core i5 or higher.
- RAM: 8GB or higher.
- 50MB free hard drive space
- Internet Connection: 1Mbps or greater

